Equitable by positionTransit and deprivation in Poznań, Poland

Equitable by position

Poznań's most deprived neighbourhoods have some of the best public transport in the city. We asked why, and whether the people who live there use it differently.

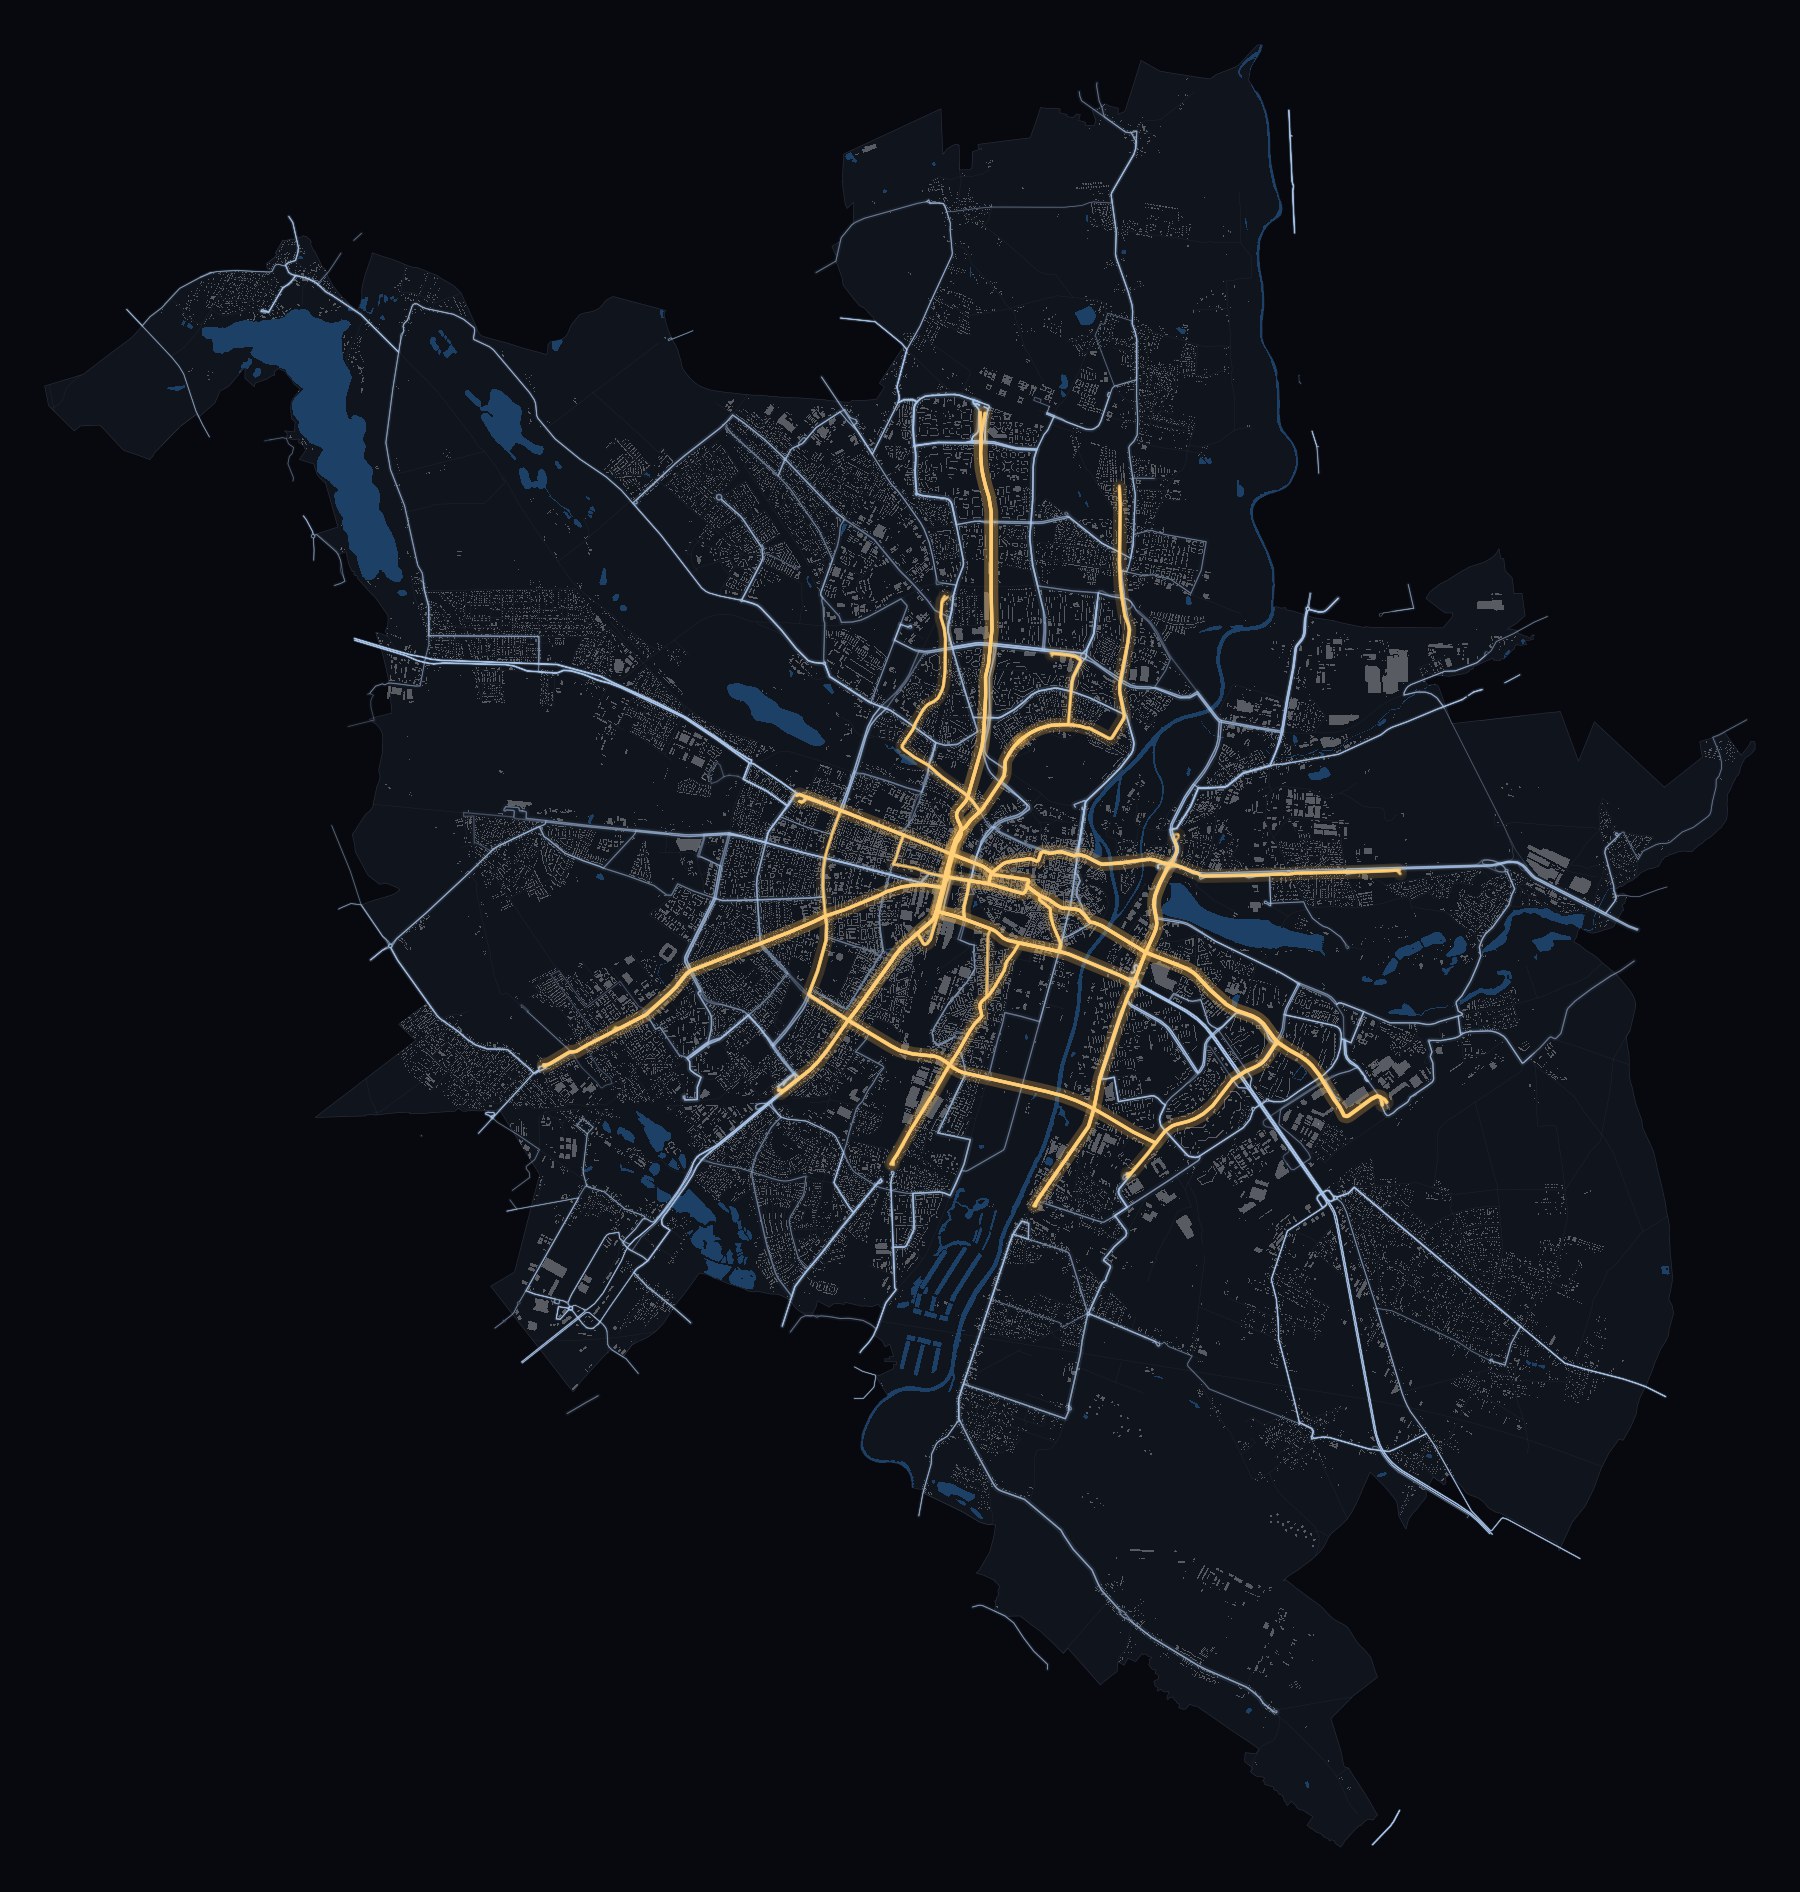
Poznań's tram and bus network on a weekday, each line drawn by its trips, trams in amber and buses in blue
Trams (amber) and day buses (blue) on a weekday, each line drawn by its trips. October 2025 timetable.

Public transport is meant to serve those who need it most. Most of what we know about whether it does comes from cities where poverty lies at the edge, far from the jobs and the trunk lines. In Poznań, a city of about 530,000 people in western Poland, it lies mostly in the core and the inner ring, as in many post-socialist cities of Central and Eastern Europe.

We followed ten months of 2025 through the door counters of the city's trams and buses, at its 607 stop complexes, and set them against the timetable and the deprivation of its 42 neighbourhoods. Do more and less deprived areas use transit differently because of what the network offers them, or because of how their residents ride? A pulse of places, and a pulse of people.

The answer is mostly the first. Deprived areas are served well because of where they are, not because the network was aimed at them.

Open the mapThe findings

The network

18 tram lines and 116 day bus lines, with 22 more at night. On a weekday they make about 10,400 trips.

The network is radial. The tram lines meet in the centre and run out along the main roads to the large housing estates. The estates of Piątkowo and Winogrady in the north are linked to the centre by a rapid tram on its own track, built in the 1990s, which carries lines 12, 14, 15 and 16. The outer districts are served by buses, many of them feeding the trams.

Most vehicles carry door counters, which record how many people board and alight at each stop: 45% of the 67.9 million stop visits from January to October 2025.

Lines and trips: ZTM Poznań timetable (GTFS), October 2025, Tuesday to Thursday, day lines; night lines are numbered 2xx. Counts: vehicle location and passenger counting records of the PEKA system. On the rapid tram: Gadziński & Radzimski (2016).

Where poverty lies

Deprivation in Poznań is highest in the tenement districts of the pre-war core and inner ring, such as Łazarz and Stare Miasto, and in one large estate, Nowe Winogrady Wschód. It is lowest in the large estates of the north.

We measure it by registered unemployment and social assistance per 1,000 residents of each of the 42 neighbourhoods, in the city's 2019 and 2021 rounds; the high scores of Główna and Krzesiny come from single institutions. Counted by residents, nearly three quarters of the residents of the most deprived third of stop catchments also live in the third with the best access to jobs.

Stop by stop

Every stop in Poznań and the streets within 400 m of it on foot. Point at a stop, or tap it, to see who lives around it, what it can reach and which lines serve it.

Ctrl + scroll or pinch to zoom · drag to move
Loading the city…

Buildings and roads: BDOT10k (GUGiK). Neighbourhood boundaries: © OpenStreetMap contributors. Timetable: ZTM Poznań, October 2025. Catchments: each address to the stop complex it reaches soonest on foot, up to 400 m. Streams: each third's share of weekday ride-kilometres, estimated from door counts; no counts are shown.

Prime access

From the median stop of the most deprived third, a rider reaches 32% of the city's jobs within 30 minutes in the morning peak. From the least deprived third, 9%.

Most deprived thirdLeast deprived third
City jobs within 30 minutes32%9%
Time to the Old Market Square24min32min
Distance from the centre3.3km5.4km
Median ride2.6km3.1km

The advantage holds in the early morning, in the evening and on Sundays. By the usual standard of transport equity, access to jobs is progressive.

Median stop of each third of the 428 compared stop catchments, ranked by deprivation. Access by the October 2025 timetable, morning peak 07:00–09:00, from a modelled 200 m grid of jobs.

Position, not targeting

Deprived stops have no more service than other stops at the same distance from the centre and in the same direction. Their advantage is where they are.

To see how much of it is geography, keep the network and move deprivation. Re-allocate the same 42 neighbourhood scores so that deprivation rises with distance from the centre, as in cities where poverty lies at the edge.

The same network would then give the most deprived third 3.8% of the city's jobs within 30 minutes and the least deprived 42.5%. Where deprivation does lie at the edge, in five neighbourhoods south of the centre served by buses alone, the network gives it no advantage: beyond 6 km they reach 1.9% of the city's jobs within 30 minutes, against 4.9% for the rest of the periphery.

Median stop of the most and the least deprived third. Mirror allocation: the most deprived score to the most distant neighbourhood, and so on.

Two streams

Riders from more and less deprived areas use the lines on offer much alike, so the network decides where they go: in two streams that cross at the centre.

Riders from the least deprived third ride north–south, along the rapid tram from Piątkowo and Winogrady to Rataje. Riders from the most deprived third ride west–east, on shorter routes from Ogrody, Jeżyce and Łazarz to Śródka. Where they get off, in the centre, the streams meet.

It looks like segregation, but most of it would appear wherever deprivation lay: scattered at random 999 times, or turned 47 ways around the centre, the same scores give about as much separation between corridors. Only the riders of the least deprived estates keep apart on their own lines more than that geography explains.

Show the streams on the map

The pulse of people

Once position on the network is held fixed, we detect little difference in how much, when or how responsively transit is used.

Each row is a gap between more and less deprived stop catchments. Switch from the raw gap to the gap net of position on the network, then net of land use and population too.

Most gaps vanish once position is held fixed. The one that survives with confidence, the deprivation of destinations, depends on where the lines run, so it belongs to places. That is not the same as no difference: when we injected a threefold difference in early boardings into the counts, these comparisons usually missed it. Door counts by area show the pulse of places; the pulse of people needs data on riders.

Nine of the 22 measures in the paper. Slopes in standard deviations per standard deviation of catchment deprivation, 95% intervals. A filled dot: the gap passes a false-discovery-rate correction across the 22 measures.

The post-socialist city

The large housing estates built under state socialism housed a broad social mix, and most have aged without declining. In Poznań, as in other Polish cities, deprivation concentrated instead in parts of the pre-war inner city.

Large housing estates
Built under state socialism at the edge of the city, they still house a broad mix of residents. On average they have aged without declining, though their paths diverge locally. Kovács & Herfert (2012); Temelová et al. (2011).
The pre-war inner city
Tenement districts such as Łazarz, Wilda and Jeżyce combine dense, mixed uses and good transit with old housing, much of it in poor repair. Social-assistance records have placed Poznań's strongest concentrations of poverty there. Kotus (2006); Weltrowska & Kisiała (2014); Kubeš & Kovács (2020).
Slow regeneration
Since 2006 the city has regenerated parts of the core, and prices and rents have risen. Gentrification has been slow and filtered by institutions: municipal housing and protected tenancies keep many deprived residents in the core. Ciesiółka & Maćkiewicz (2020); Bernt & Ogrodowczyk (2025).
Elsewhere
In many Western cities the gentrification of transit-rich cores has gone together with the suburbanisation of poverty. Central deprivation is not only post-socialist, though: in Toronto, disadvantaged areas have had better transit access than the rest of the region. Hochstenbach & Musterd (2018); Foth et al. (2013).

What it is for

By the usual standard of transport equity, Poznań scores well. But its advantage is positional, and it is not enough on its own.

Deprived areas have far better access than the least deprived, and remain deprived. And the advantage lasts only while deprived residents stay where the network serves them well. Move some of them out:

25%

A stylised illustration, not a forecast. Means over the residents of the most deprived third after the move. Access-poverty line: half the median access, 13.9% of the city's jobs within 30 minutes.

Keep the advantage
Keeping the municipal housing stock in the core may help protect the access of the residents who need it most. This study does not test it.
A floor for the edge
Standards that guarantee everyone a minimum level of access point to the deprived enclaves the network serves least. Martens (2016); Pereira, Schwanen & Banister (2017).
Plan works with riders in mind
Riders from more and less deprived areas load different parts of the network. Closing the northern rapid tram falls more on riders from the least deprived areas; closing the inner city's west–east axis or the lines to the main station falls more on riders from deprived ones.

Compact, mixed, well-served cores are what sustainable-city policy asks for, from transit-oriented development to the 15-minute city. Poznań shows that such a core can also be where deprived residents are best served by public transport, as long as they can stay in it.

The study and the team

42 neighbourhoods, 607 stop complexes, ten months of door counts and one timetable.

Every address goes to the stop complex it reaches soonest on foot, up to 400 m, and each stop takes the mean deprivation of the residents around it. Where riders get off is estimated on each counted trip; spread over a stop's lines by their departures, the same estimate gives what the network offers. Door counts see areas, not people, and only those who ride.

Equitable by position: deprivation, network geography and public transport use

Marcin Wozniak and Gabriele Filomena. Manuscript, 2026.

The analysis code is on GitHub. The door counts and the address register of residents cannot be shared; the timetable, the topographic database, the revitalisation indicators and OpenStreetMap are public.

  • Marcin Wozniak

    Faculty of Human Geography and Planning, Adam Mickiewicz University, Poznań.

    wozniak2.github.io
  • Gabriele Filomena

    Geographic Data Science Lab, University of Liverpool.

    PedSimCity